
CAGR here is a measurement, not a forecast
You type a start value, an end value, and years. The page reports the constant annual rate that connects them. That number is allowed to be 4% or 18%. It is not allowed to be pasted into the SIP slider as next decade's assumed return.
CAGR also ignores the path: a folio that crashed and recovered can show the same CAGR as a smooth climb. For money you will still contribute, use the SIP calculator and a conservative rate not last year's CAGR.
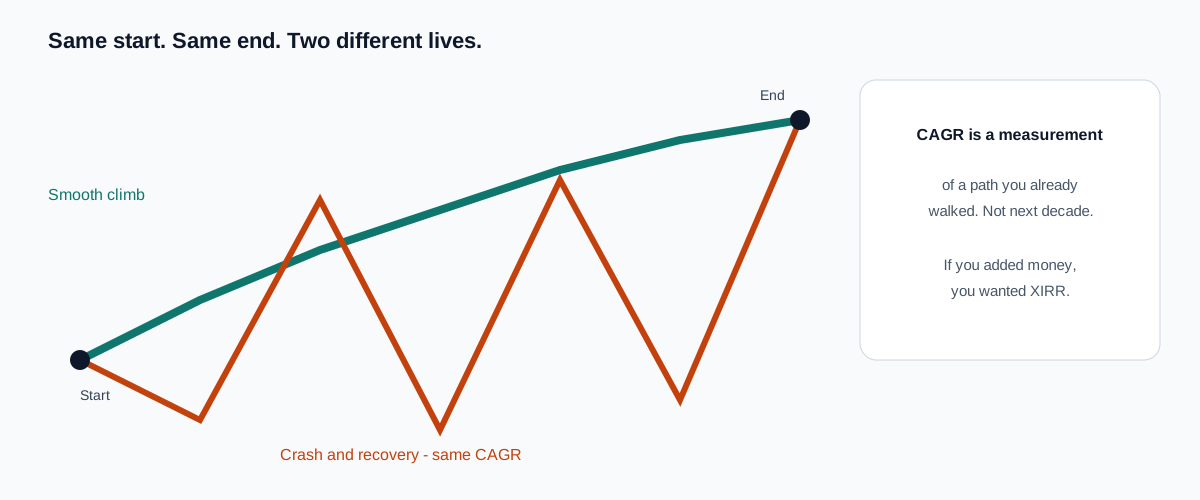

Same start and end. Path still matters.
Motion is the same maths as the worksheet. Reduced-motion browsers skip the grow.
Calculator education
When to use this calculator
Use this page to turn a start value, an end value, and a number of years into the constant annual rate that connects them. It measures what already happened (or a hypothetical pair of points).
How to read your result
CAGR is the geometric average rate. Absolute return is the total percentage change, ignoring how many years it took. A 100% gain in one year and a 100% gain in ten years are the same absolute return and very different CAGRs.
The yearly table shows a smooth path at that CAGR. Real prices bounced. This page is not XIRR and is not a forecast.
Key assumptions and limitations
- One start amount and one end amount; no contributions or withdrawals in between.
- The rate is implied by those two points and the years you typed.
- Dividends, tax, and inflation are not in the basic CAGR unless you fold them into the values yourself.
Common mistakes
- Using CAGR for an SIP (irregular cash flows need XIRR, which this page does not compute).
- Pasting a past CAGR into the SIP slider as next decade’s assumed return.
- Treating a smooth CAGR line as proof the investment was calm.
Related guides
Related calculators
CAGR is a measurement between two values. It is not a prediction of the next period’s return. Full disclaimer.
Author / methodology
What I refuse to do with a CAGR
- I do not paste last decade’s CAGR into the SIP slider as next decade’s assumed return.
- If I added money along the way, I wanted XIRR, not this page.
- I deflate the finish. A 5× nominal can still be a 2× in today’s rupees.
CAGR is a measurement of a path you already walked
It is not a fund, not an AMC, and not a forecast you are allowed to paste into the SIP slider.
| What you typed | What the number is | What it is not |
|---|---|---|
| Start and end value | The constant annual rate that connects two points | The path: a crash-and-recovery can share the same CAGR as a climb |
| A scheme factsheet CAGR | History of that folio, after TER, before your tax | A forecast you can paste into the SIP slider |
| An index CAGR | Price or total-return of the index, not your SIP | Your lumpsum timing or your expense ratio |
If the years include a contribution, you wanted XIRR, not this page.
This page measures a path you already walked. These bars are illustrations of the formula, not forecasts.