What Is a SIP Calculator with Inflation Adjustment?
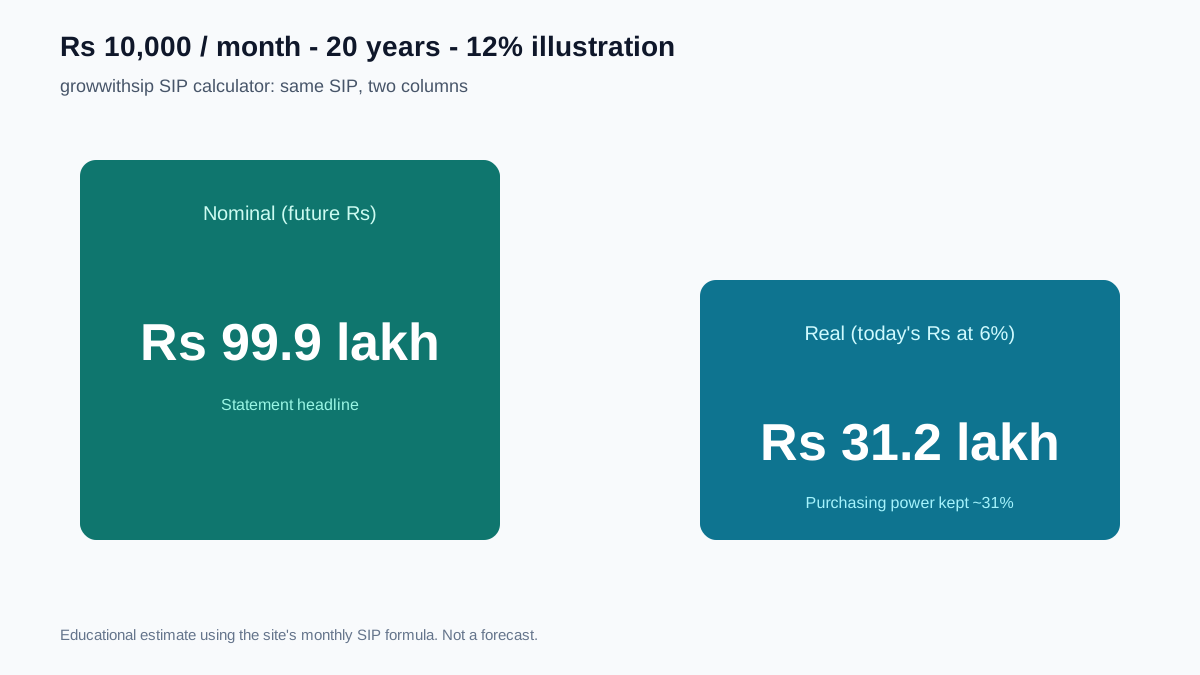
A SIP calculator with inflation adjustment is an advanced financial planning tool that shows you the real valueof your future corpus in today's rupees. While a standard SIP calculator tells you that investing ₹10,000 per month for 20 years at 12% annual returns will give you ₹99.9 lakhs, an inflation-adjusted calculator reveals a more honest picture - at 6% average inflation, that ₹99.9 lakhs will have the purchasing power of only about ₹31 lakhs in today's money.
This distinction is critical for anyone serious about long-term investing, whether your goal is building a retirement corpus, funding your child's higher education, or saving for a home purchase. Without accounting for inflation, you risk saving for a number that looks impressive on paper but falls short of your actual needs. Our calculator bridges this gap by computing the inflation-adjusted corpus alongside the nominal figure, so every financial decision you make is grounded in reality rather than inflated projections.
Nominal Returns vs Real Returns - The Critical Difference
Every mutual fund factsheet and investment calculator advertises nominal returns - the headline percentage your investment earns before adjusting for inflation. But what actually determines whether you meet your financial goals is the real rate of return: the growth left after inflation erodes your purchasing power.
The relationship between nominal and real returns is captured by the Fisher equation:
At 12% nominal returns and 6% inflation, your real return is approximately 5.66% - not 6% as a simple subtraction might suggest. Over long investment horizons, this distinction compounds into a massive gap:
| Monthly SIP | Duration | Nominal Value (12%) | Real Value (6% Inflation) | Purchasing Power Lost |
|---|---|---|---|---|
| ₹10,000/mo | 10 Years | ₹23.2 Lakhs | ₹13.0 Lakhs | 44% |
| ₹10,000/mo | 20 Years | ₹99.9 Lakhs | ₹31.2 Lakhs | 69% |
| ₹10,000/mo | 30 Years | ₹3.53 Cr | ₹61.4 Lakhs | 83% |
The longer your investment horizon, the larger the gap between nominal and real values. This is why an inflation-adjusted return calculator is essential for any financial goal beyond 5 years. Try different SIP amounts in the calculator above to see this difference for yourself.
How Inflation Erodes Your Purchasing Power - Real-Life Examples
Inflation works like compounding- but against you. Just as your SIP grows through the power of compound interest, the value of money shrinks through compounding inflation. Here is what ₹1 Crore received in the future will actually be worth in today's rupees across common inflation assumptions:
| Time Horizon | At 4% Inflation | At 5% Inflation | At 6% Inflation | At 7% Inflation | At 8% Inflation |
|---|---|---|---|---|---|
| After 20 Years | ₹45.6 L | ₹37.7 L | ₹31.2 L | ₹25.8 L | ₹21.5 L |
| After 25 Years | ₹37.5 L | ₹29.5 L | ₹23.3 L | ₹18.4 L | ₹14.6 L |
| After 30 Years | ₹30.8 L | ₹23.1 L | ₹17.4 L | ₹13.1 L | ₹9.9 L |
At 6% inflation, ₹1 Crore received 30 years from now buys only what ₹17.4 lakhs buys today. At 8% inflation - common for education and healthcare costs - the same ₹1 Crore is worth just ₹9.9 lakhs in present value terms. This table illustrates why goal-based investing without an inflation-adjusted target is fundamentally flawed.
How Much Extra SIP Is Required Because of Inflation?
One of the most practical questions investors ask is: "If I want ₹1 Crore in today's purchasing power 20 years from now, how much should I invest monthly?" The answer is often 3× or more than what a nominal calculation suggests. Here is a comparison at 12% expected returns and 6% annual inflation over 20 years:
| Goal (Today's Value) | Inflation-Adjusted Target | SIP Needed (Adjusted) | SIP Without Adjustment |
|---|---|---|---|
| ₹50 Lakhs | ₹1.60 Cr | ₹16,050/mo | ₹5,000/mo |
| ₹1 Crore | ₹3.21 Cr | ₹32,100/mo | ₹10,000/mo |
| ₹2 Crore | ₹6.41 Cr | ₹64,200/mo | ₹20,000/mo |
| ₹5 Crore | ₹16.04 Cr | ₹1,60,500/mo | ₹50,000/mo |
The inflation multiplier for 20 years at 6% is 3.2×. For a goal worth ₹1 Crore in today's terms, you actually need to target ₹3.21 Crore nominally - requiring ₹32,100 per month, not the ₹10,000 that a basic calculator suggests. Use the Goal Planner to calculate exact SIP amounts for your personal financial targets.
Common Inflation Rate Assumptions and Their Impact on SIP Wealth
The inflation rate you assume dramatically changes your required SIP amount. Here is how different expected inflation assumptions affect the real value of a ₹25,000/month SIP at 12% returns over 20 years:
| Inflation Rate | Nominal Corpus | Real Value (Today's ₹) | Real Return (CAGR) |
|---|---|---|---|
| 4% (Optimistic) | ₹2.50 Cr | ₹1.14 Cr | 7.69% |
| 5% (Moderate) | ₹2.50 Cr | ₹94.2 L | 6.67% |
| 6% (Balanced) | ₹2.50 Cr | ₹77.9 L | 5.66% |
| 7% (Conservative) | ₹2.50 Cr | ₹64.6 L | 4.67% |
| 8% (Pessimistic) | ₹2.50 Cr | ₹53.7 L | 3.70% |
The difference between a 4% and 8% inflation assumption on the same ₹25,000 SIP is staggering - ₹1.14 Cr vs ₹53.7 L in real terms. For conservative retirement planning, using 6-7% inflation is recommended. For education planning, use 8-10% since tuition fees historically inflate faster than general prices.
Why Use a SIP Return Calculator with Inflation?
A standard Systematic Investment Plan (SIP) calculator shows you the nominal value of your investments at maturity. While a large final number is encouraging, it can be misleading because it ignores the silent decay of purchasing power caused by inflation. Over long horizons of 10, 20, or 30 years, inflation reduces what your money can actually buy.
In the Indian market, long-term retail price inflation historically averages around 5% to 6%. At this rate, a target corpus of ₹50 Lakhs today will buy less than half as many goods in 15 years. By using our SIP calculator with inflation adjustment, you discount the future maturity value back to today's purchasing power. This gives you a realistic, honest estimate of your future wealth, ensuring that your financial targets are sufficient to fund your actual lifestyle goals.
Understanding Rupee Cost Averaging: The SIP Advantage
One of the primary benefits of investing through a monthly SIP rather than a lump sum is Rupee Cost Averaging. When you invest a fixed amount every month, your money automatically buys more mutual fund units when the market falls, and fewer units when the market rises. Over time, this averages out your purchase cost per unit, eliminating the risk of trying to time the stock market.
Numerical Example: How Rupee Cost Averaging Works
Assume you commit to a monthly investment of ₹10,000 in an equity mutual fund scheme. Let's see how your purchase cost behaves over a volatile 3-month period:
| Month | Monthly Investment | NAV (Unit Price) | Units Purchased |
|---|---|---|---|
| Month 1 | ₹10,000 | ₹100 | 100.00 Units |
| Month 2 (Market Correction) | ₹10,000 | ₹80 | 125.00 Units |
| Month 3 (Market Recovery) | ₹10,000 | ₹110 | 90.91 Units |
| Cumulative Totals | ₹30,000 | Average NAV: ₹96.67 | 315.91 Units |
*By investing systematically, your average purchase cost per unit is ₹94.96 (₹30,000 / 315.91 units), which is lower than the average market NAV of ₹96.67. When the market recovers in Month 3, you benefit from the extra units accumulated during the dip.
Expected SIP Return Rates Across Mutual Fund Categories
Expected return rates vary depending on the underlying asset class of the mutual fund scheme. Long-term benchmarks in India suggest the following average return CAGRs:
- Equity Mutual Funds (12% - 15% Expected Return): Ideal for long-term goals over 7 years. These invest primarily in stocks. While they carry short-term volatility, they have historically delivered the highest inflation-beating returns.
- Debt Mutual Funds (6% - 8% Expected Return): Suitable for short to medium-term goals (3 to 5 years). These invest in fixed-income securities like government bonds and corporate debentures, offering stability with lower returns.
- Hybrid Mutual Funds (9% - 11% Expected Return): Suitable for conservative investors with a 5-year horizon. These split allocation between equity and debt to balance growth and downside protection.
How does our SIP Calculator compute returns?
Our tool runs a two-step calculation model to generate both nominal and real inflation-adjusted values:
Step 1: Calculating the Future Value (FV)
To determine the nominal maturity value, the calculator utilizes the standard formula:
Where:
- M = Nominal Future Value (Maturity Amount)
- P = Monthly investment installment
- r = Monthly rate of return, derived from the expected annual rate. In our calculator, we use the compound monthly return equation:
r = (1 + Expected Return Rate)1/12 - 1. This is technically more precise than simply dividing the annual rate by 12. - n = Total number of monthly installments (Tenure in years × 12)
Step 2: Discounting for Inflation to Compute Real Value
Once the nominal future value (M) is determined, the calculator discounts it back to the present day using the compounding inflation discount equation:
Where:
- i = Expected annual inflation rate (defaulted at 6% p.a.)
- t = Investment tenure in years
SIP Taxation Slabs in India: Latest Capital Gains Rules
When planning your goals, you must factor in the tax liabilities applicable at redemption. Mutual fund redemptions in India are subject to capital gains tax based on the asset class and holding period. For equity-oriented mutual funds, the tax rules post-July 2024 budget (still current under post-July 2024 equity taxation rules) are structured as follows:
- Short-Term Capital Gains (STCG): If mutual fund units are redeemed within a holding period of 12 months or less, the gains are taxed at flat 20%.
- Long-Term Capital Gains (LTCG): If mutual fund units are redeemed after a holding period of more than 12 months, the gains are taxed at 12.5%. Additionally, the first ₹1.25 Lakh of LTCG accumulated in a financial year is completely tax-exempt.
Important note on SIP taxation: Since SIPs consist of multiple monthly installments, each monthly installment is treated as a separate investment with its own purchase date. Therefore, to qualify for LTCG, each individual installment's units must be held for more than 12 months before redemption (First-In, First-Out rule).
SIP vs. Lumpsum: Which is Better?
A SIP is generally best for salaried individuals who receive a regular monthly income, as it encourages financial discipline and mitigates timing risk through rupee cost averaging.
Conversely, a lumpsum is suitable when you have a large sum of idle cash, such as an annual bonus or proceeds from an asset sale. Lumpsums compound from day one, which historically yields higher absolute returns over long horizons if invested during market corrections. However, they carry higher short-term risk if the market enters a downturn immediately after investment. If you are holding a lumpsum during a bull run, setting up a Systematic Transfer Plan (STP) to transfer fixed amounts from a debt fund to equity is a highly effective way to mitigate market peak risk. You can compare these strategies in detail using our Lumpsum Calculator or plan specific targets with the Goal Planner.
Goal-Based Investing with Inflation
Every major financial goal - retirement, a child's education, or buying a home - is a moving target. What costs ₹X today will cost significantly more by the time you need the money. Goal-based investing with inflation means first calculating the future value of your goal, then working backwards to determine the required monthly SIP.
Retirement Planning Using Inflation-Adjusted SIP
Suppose you are 30 years old and plan to retire at 60. Your current monthly expenses are ₹50,000. At 6% inflation, your monthly expenses at retirement will be approximately ₹2.87 lakhs. To sustain a 25-year retirement with a Systematic Withdrawal Plan (SWP), you would need a corpus of approximately ₹5-6 Crore in nominal terms. Working backwards at 12% expected returns, the required monthly SIP is about ₹17,000-₹20,000. Without inflation adjustment, a naive calculation might suggest ₹5,000-₹6,000 per month - leaving a massive shortfall. Use our Retirement Calculator for a detailed breakdown.
Child Education Planning with Inflation
Education inflation in India runs at 8-12% annually - significantly higher than general CPI. An engineering degree costing ₹15 lakhs today will cost approximately ₹63 lakhs in 15 years at 10% education inflation. An MBA costing ₹25 lakhs today could cost over ₹1 Crore. To build ₹63 lakhs in 15 years at 12% returns, you need approximately ₹12,700 per month via mutual fund SIP. Without accounting for education inflation, a parent might target ₹15 lakhs (today's cost) and invest only ₹3,000/month - reaching just ₹15 lakhs nominally, which covers only 24% of the actual future cost.
Home Purchase Planning with Inflation
Property prices in Indian metros have historically appreciated at 5-8% annually. If a flat costs ₹80 lakhs today and you plan to buy in 7 years, at 7% appreciation it will cost approximately ₹1.28 Crore. Assuming a 20% down payment (₹25.6 lakhs), you need to accumulate that amount via SIP. At 12% returns, that requires approximately ₹19,500 per month for 7 years. Ignoring property inflation and targeting ₹16 lakhs (20% of today's price) would leave you short by nearly ₹10 lakhs.
SIP vs Other Investments After Inflation
The true test of any investment is not its nominal return but whether it beats inflation. Here is how a monthly investment of ₹10,000 over 20 years performs across different asset classes, after adjusting for 6% inflation:
| Investment | Expected Return | Nominal Value (20yr) | Real Value (6% Inflation) | Beats Inflation? |
|---|---|---|---|---|
| Equity SIP (Mutual Fund) | 12% | ₹99.9 L | ₹31.2 L | Yes ✓ |
| PPF | 7.1% | ₹53.0 L | ₹16.5 L | Marginally ✓ |
| Fixed Deposit | 7% (pre-tax) | ₹52.4 L | ₹16.3 L | No (post-tax) ✗ |
| Gold | ~9% | ₹67.4 L | ₹21.0 L | Yes ✓ |
| Savings Account | 3.5% | ₹34.8 L | ₹10.8 L | No ✗ |
The total invested amount across all options is ₹24 Lakhs. While every option shows nominal growth, only equity SIP and gold deliver meaningful wealth creation above inflation. Fixed deposits, despite appearing safe, actually destroy wealth for taxpayers in the 20–30% bracket where post-tax returns drop below 5%. PPF offers tax-free returns but with a 15-year lock-in and ₹1.5 lakh annual limit. Compare FD performance using our FD Calculator and PPF projections with our PPF Calculator.
Expected Inflation Rates in India - How Investors Should Use Them
The Reserve Bank of India (RBI) operates under a flexible inflation targeting framework with a target of 4% CPI inflationand a tolerance band of ±2%. However, India's actual CPI inflation has averaged between 5.5–6.5% over the past two decades. For investment planning purposes:
- General expenses (food, transport, utilities): Use 5–6% inflation. This aligns with long-term CPI trends and is suitable for general retirement planning.
- Education (school and college fees): Use 8–12%. Tuition fees in private institutions consistently outpace CPI, making this critical for education planning.
- Healthcare: Use 8–10%. Medical costs have historically risen faster than general prices.
- Housing and rent: Use 5–8% depending on the city. Metro property prices tend to inflate faster than tier-2 cities.
When using this SIP calculator with inflation, the default 6% rate is appropriate for most general financial goals. For sector-specific goals like education or healthcare, mentally increase your inflation assumption to reflect the higher cost inflation in those categories.
Mistakes Investors Make by Ignoring Inflation
Ignoring inflation while planning investments is one of the most common - and costly - financial mistakes. Here are the errors that frequently derail long-term financial plans:
- Setting retirement targets in today's rupees. A couple targeting ₹1 Crore for retirement 30 years away without inflation adjustment will have a corpus worth only ₹17.4 lakhs in today's purchasing power - barely enough for 3 years of post-retirement expenses.
- Parking long-term savings in FDs or savings accounts. At 3.5–7% returns against 6% inflation, these instruments erode your wealth in real terms. They are suitable for emergency funds, not for wealth creation.
- Stopping SIPs during market corrections. Market dips are when rupee cost averaging works hardest - you accumulate more units at lower NAVs. Stopping your SIP during corrections means buying fewer units during the cheapest period.
- Not increasing SIP amount annually. A flat ₹10,000 SIP loses approximately 6% of its real value every year. If your salary increases by 10% annually, your SIP should grow proportionally. Use a Step-Up SIP Calculator to model annual increases.
- Confusing nominal returns with real gains. A fund that returned 14% CAGR over 10 years sounds impressive - but at 6% inflation, the real CAGR is only about 7.5%. Understanding this distinction prevents overconfidence and underinvestment.
- Underestimating education inflation.Parents who plan for today's college fees without applying 8–12% annual escalation often face a 40–60% shortfall when the admission year arrives.
- Ignoring inflation in emergency funds. An emergency fund of ₹5 lakhs today should be reviewed and topped up periodically. In 10 years at 6% inflation, you would need ₹9 lakhs to cover the same expenses.
Inflation Myths vs Facts for SIP Investors
Myth: "Inflation is only 4% because RBI says so."
Fact: The 4% is RBI's target, not the actual inflation rate. India's CPI inflation has averaged 5.5–6.5% over the past decade, and category-specific inflation (education, healthcare) runs significantly higher. For financial goals planning, 6% is a practical minimum assumption.
Myth: "FDs are safe, so they protect my money from inflation."
Fact: FDs preserve nominal capital, but after tax (TDS), the effective return for most investors in the 20–30% bracket falls below the inflation rate. Your money is nominally safe but loses purchasing power every year. Compare with our FD Calculator.
Myth: "If my SIP returns 12%, inflation doesn't matter because 12% is much higher than 6%."
Fact:Over 20 years at 6% inflation, your ₹99.9 lakh corpus (from a ₹10,000 SIP at 12%) is worth only ₹31.2 lakhs in today's money. The gap grows with time - after 30 years, you retain only 17% of the nominal return's purchasing power. Inflation always matters for long-term investing.
Myth: "Gold is the best hedge against inflation."
Fact: Gold historically returns 8–10% in India, which does beat inflation. But over 20-year periods, equity mutual fund SIP at 12% significantly outperforms gold in both nominal and real terms (₹99.9 L vs ₹67.4 L nominal). Gold works as a portfolio diversifier, not a primary wealth creation tool.
Myth: "I don't need to worry about inflation if I invest in real estate."
Fact: While property prices appreciate over time, real estate is illiquid, requires large capital, and incurs ongoing costs (maintenance, taxes, registration). Adjusted for these costs and illiquidity, the real rate of return from residential property in many Indian cities has been 2–4% over the last decade. Equity SIPs offer superior risk-adjusted real returns with full liquidity.
Frequently Asked Questions
Related Calculators
Model SIPs where you increase your monthly amount annually - a powerful hedge against inflation and a way to accelerate wealth creation.
Compare how a one-time investment grows versus your SIP strategy over the same period.
Understand when equity SIPs beat fixed deposits — and when FDs still win.
Plan systematic withdrawals from your SIP corpus during retirement with inflation-adjusted monthly payouts.
Calculate tax-saving SIP returns under Section 80C with the most tax-efficient equity fund category.
Find the actual annualised return rate (real CAGR) on any investment over a period.
Set a financial target and calculate the exact monthly SIP needed to reach it with inflation adjustment.
Build a complete inflation-adjusted retirement plan with monthly expense projections and corpus requirements.
Compare fixed deposit maturity values against SIP returns to see which truly beats inflation.