
The SIP calculator opens at 12%. I chose that because every other Indian calculator does, and because a blank field would freeze users. I did not choose it because I think your folio will compound at 12% until 2046. This page exists so that default does not become a quote in a family WhatsApp group.


What 12% is on this site
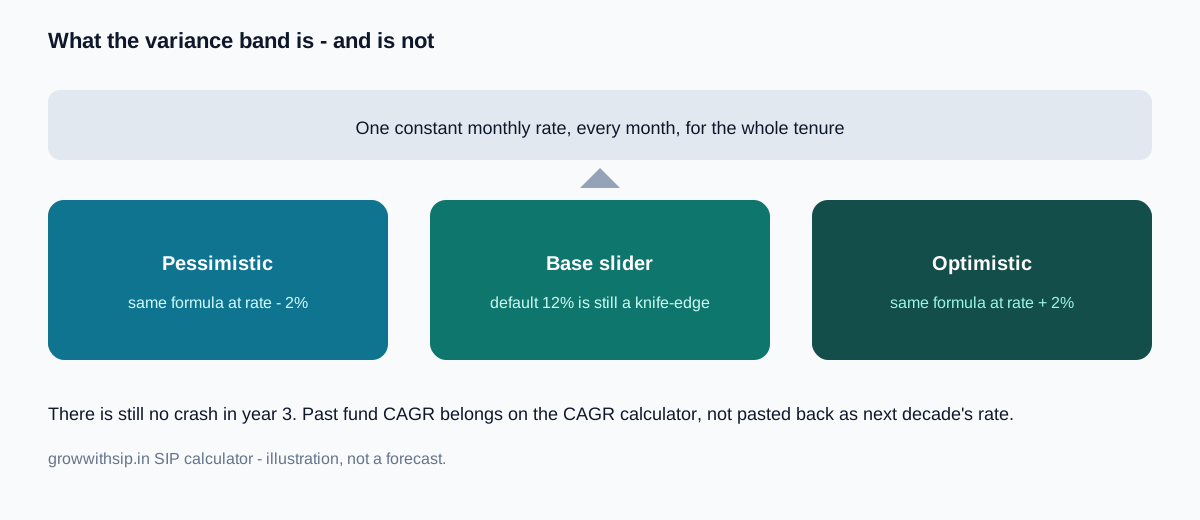
It is a constant monthly rate plugged into the future-value-of-annuity formula. Every year is the same. There is no crash in year 3. There is no 40% year in year 11. Expense ratios are not subtracted unless you lower the slider. Direct versus regular is your job. The year-by-year table at 12% is a textbook curve. I show inflation next to it so the textbook at least admits prices rise. I still need you to admit markets wobble. How inflation is applied is a separate note; this one is only about the return slider.
A worked SIP: 8%, 12%, and the +2% band
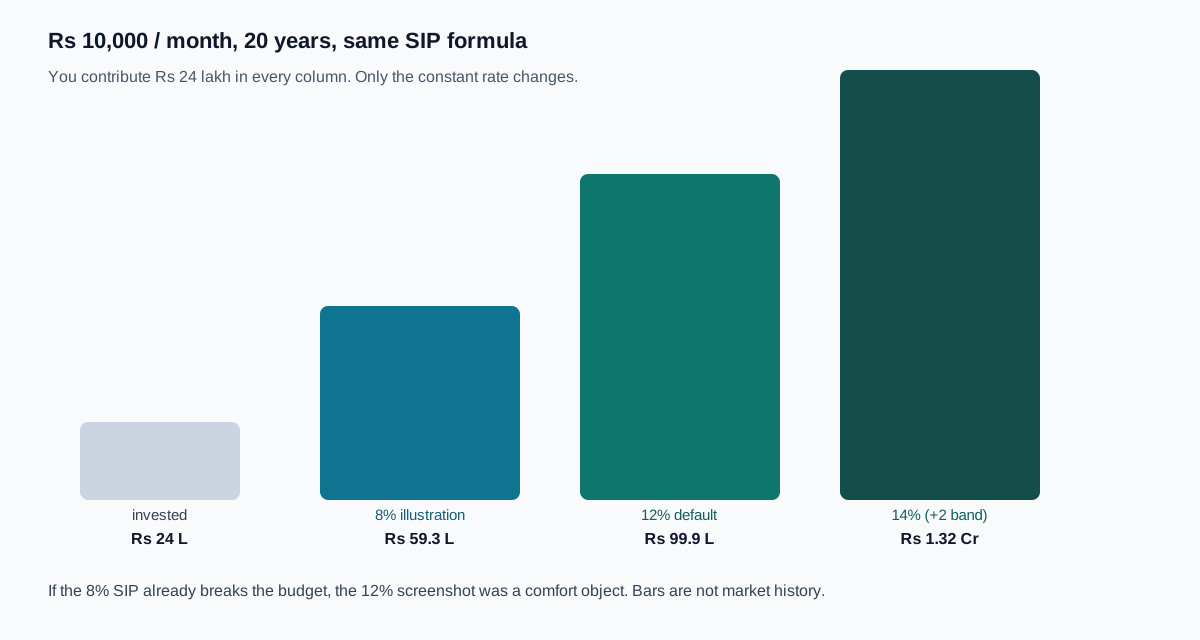
Leave ₹10,000 a month for 20 years. You contribute ₹24 lakh of your own money in every run. Same engine as the live SIP page:
| Constant rate | Illustrated maturity | What that run is for |
|---|---|---|
| 8% | about ₹59.3 lakh | Stress: does the SIP still fit the budget? |
| 10% (−2% around 12%) | about ₹76.6 lakh | Pessimistic variance band |
| 12% (default) | about ₹99.9 lakh | Illustration only |
| 14% (+2% around 12%) | about ₹1.32 crore | Optimistic variance band |

How I actually use the sliders
Run the goal at 8% and at 12% with the same inflation. If the 8% SIP already breaks the household budget, the 12% screenshot was a comfort object. The on-page variance control (±2% around the chosen rate) is a quick fan of three constant rates, not Indian index history. For “what did this folio actually do?”, use the CAGR calculator on real start and end values. That number is a measurement. It is allowed to be 4% or 18%. It is not allowed to be pasted back as next decade’s expected return without a conversation with someone registered to give advice.

Step-up SIP at 12% plus a 10% annual hike is two illustrations stacked. It is a good way to see that raising the debit matters. It is a bad way to promise ₹2 crore.
Behaviour is not in the formula
The engine assumes you never stop the mandate. Real people stop after a 20% drawdown. A 12% average that includes years you were not invested is not your 12%. If you know you will panic, size equity smaller or keep a larger FD sleeve SIP vs FD is that job assignment and type a lower SIP rate rather than a heroic one.
Nothing here is a scheme recommendation. AMFI and fund factsheets are the documents for past performance, with all their caveats. growwithsip will not rank funds.