
Bank FD screens show a rate and a maturity. They rarely show the compounding convention in the same font. The FD calculator uses A = P(1 + r/n)nt with n defaulting to 4 (quarterly). That is the code. If your deposit is monthly compounding, change n. If your deposit pays interest out every quarter and you spend it, you are not on this curve at all.


Frequency is a small gap; payout is not
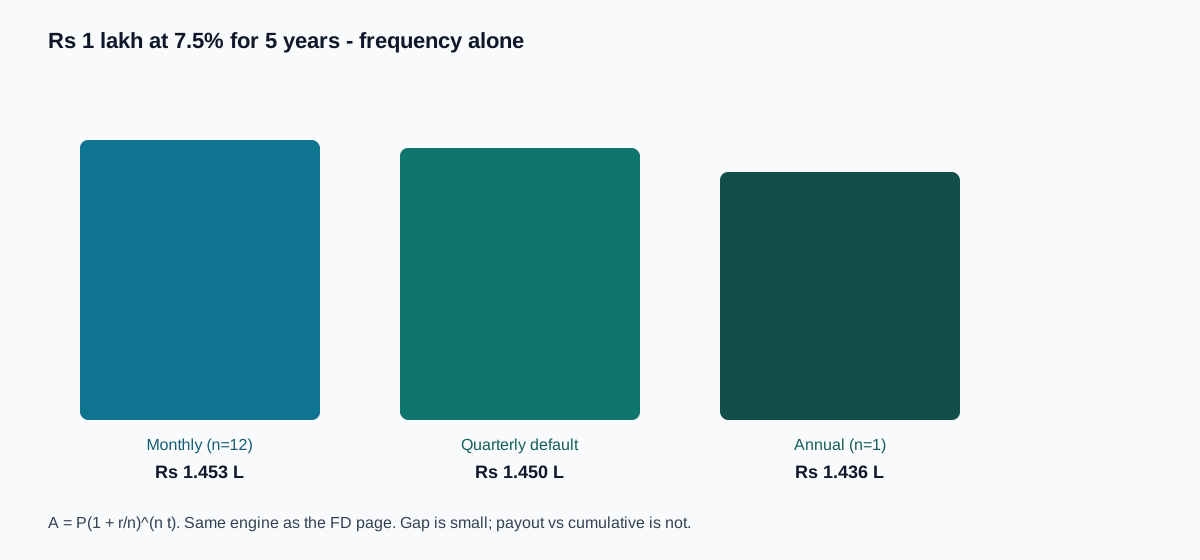
Leave the FD page at its defaults: ₹1 lakh, 7.5%, 5 years. Same engine:
| Compounding | Illustrated maturity | Interest |
|---|---|---|
| Monthly (n = 12) | about ₹1.453 lakh | about ₹45,300 |
| Quarterly (default n = 4) | about ₹1.450 lakh | about ₹45,000 |
| Annual (n = 1) | about ₹1.436 lakh | about ₹43,600 |
Switching tabs while keeping principal, rate, and tenure fixed is the demonstration. If two banks differ by lakhs on the same rupees, you are probably mixing payout with cumulative, not monthly with quarterly.

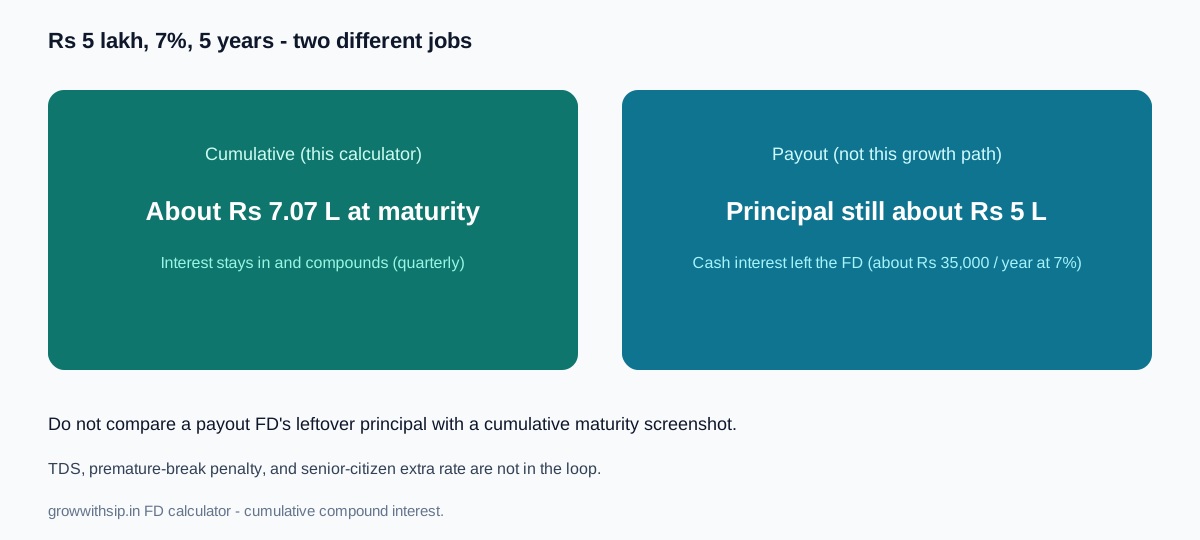
Cumulative versus payout
Cumulative: interest stays inside and earns interest. The yearly table shows a rising value. Payout: you receive interest as cash. Maturity is roughly the principal, and the “return” lived in your savings account, where it may have earned 3% and been spent on groceries.
Worked example from the FD page: ₹5 lakh, 7%, 5 years, quarterly compounding. Cumulative maturity is about ₹7.07 lakh (about ₹2.07 lakh interest). A payout FD at 7% on the same principal still shows about ₹5 lakh at the end and pays about ₹35,000 a year if you do not reinvest. Comparing that leftover principal to a SIP corpus is an accounting error. Comparing a cumulative FD to a SIP is still risk-and-tax SIP vs FD - but at least both are piles.

Why the bank slip disagrees
- Senior-citizen extra you did not type.
- Monthly versus quarterly compounding.
- Interest payout versus cumulative.
- Premature-break penalty, which this tool does not model.
- TDS leaked from the compounding base.
- Day-count and rounding the bank uses.
Type the rate from the advice letter, not from a “best FD” table. Those tables mix tenures and payout styles. The RD calculator is the fair cousin when money arrives monthly.
Inflation and tax sit outside
I did not auto-deflate FD maturity. A 7% cumulative FD at 6% inflation is a thin real result after slab tax. DICGC insurance, premature withdrawal rules, and auto-renewal at a new rate are bank features. The calculator will not know you auto-renewed into a worse card. FD interest is usually taxed at slab, often with TDS; confirm the current tax position with the Income Tax Department when you file. Rules and rates can change. Check the latest notification or official guidance before making a financial decision.
If a relationship manager’s “₹X at maturity” and this page differ by a few rupees, rounding wins for the bank. If they differ by lakhs, check payout versus cumulative, or a different n.