
Every calculator on this site that compounds over years prints a table. I put it there because a single maturity number hides the path. People plan with the path: “when do I cross ₹50 lakh?”, “how much of this EMI is still interest?”, “did inflation already eat year 8?”. This note is how to read those rows without treating them like a passbook.


SIP, lumpsum, step-up: invested versus value
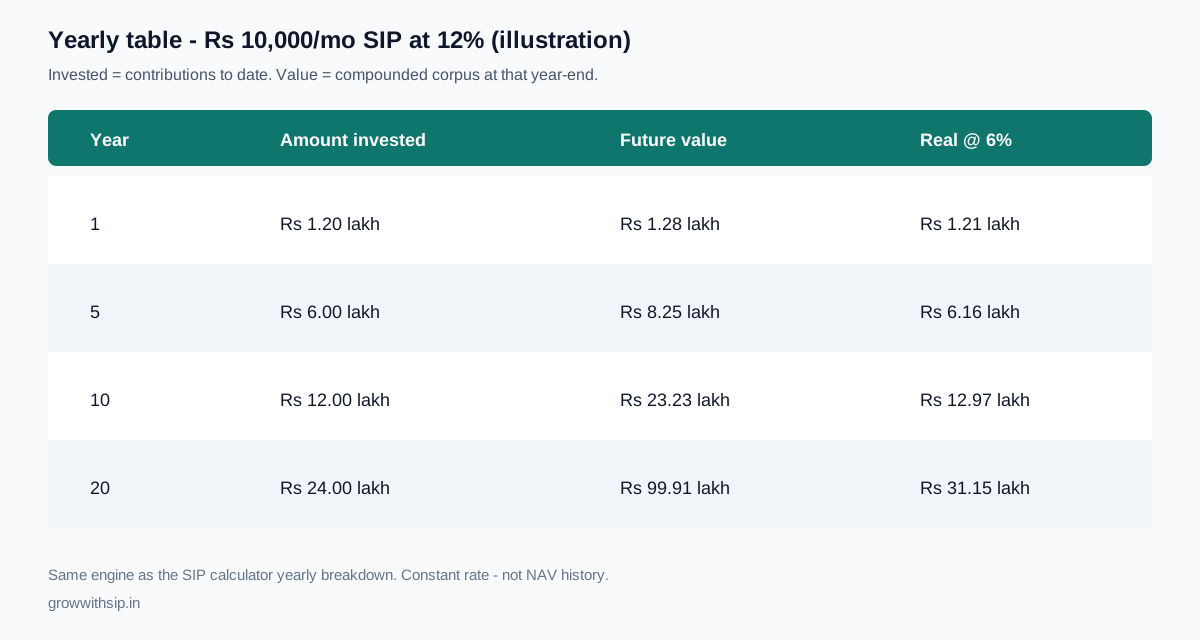
On the SIP calculator, amount invested is contributions to date (monthly SIP × months). Future value is the compounded corpus at that year-end at your constant assumed return. If inflation is on, real value is that future value divided back to today’s rupees at that year. Year 10 real is not “year 10 nominal minus 10 times 6%.” It is a level deflator for that horizon. How inflation is applied is the sister note.
For ₹10,000 a month at a 12% illustration: year 1 you have put in ₹1.20 lakh and the value is about ₹1.28 lakh. Year 10: ₹12 lakh in, about ₹23.2 lakh nominal, about ₹13.0 lakh real at 6% inflation. Year 20: ₹24 lakh in, about ₹99.9 lakh nominal, about ₹31.2 lakh real. The jump between year 10 and year 20 is compounding at a flat rate not a promise that years 11–20 will be kind.

Lumpsum rows keep invested equal to the opening cheque. Value grows at (1 + r)year. That is annual compounding, which is not the same as the SIP engine’s monthly compounding. If you compare a SIP table to a lumpsum table, keep the rate and the end year the same, and do not invent a lumpsum you do not have. SIP vs lumpsum is the comparison; the tables are the evidence.
Step-up SIP changes the debit once a year. The invested column then grows faster than a flat SIP. Do not compare a step-up invested total with a flat SIP’s invested total and call it “same money.”
EMI: principal versus interest
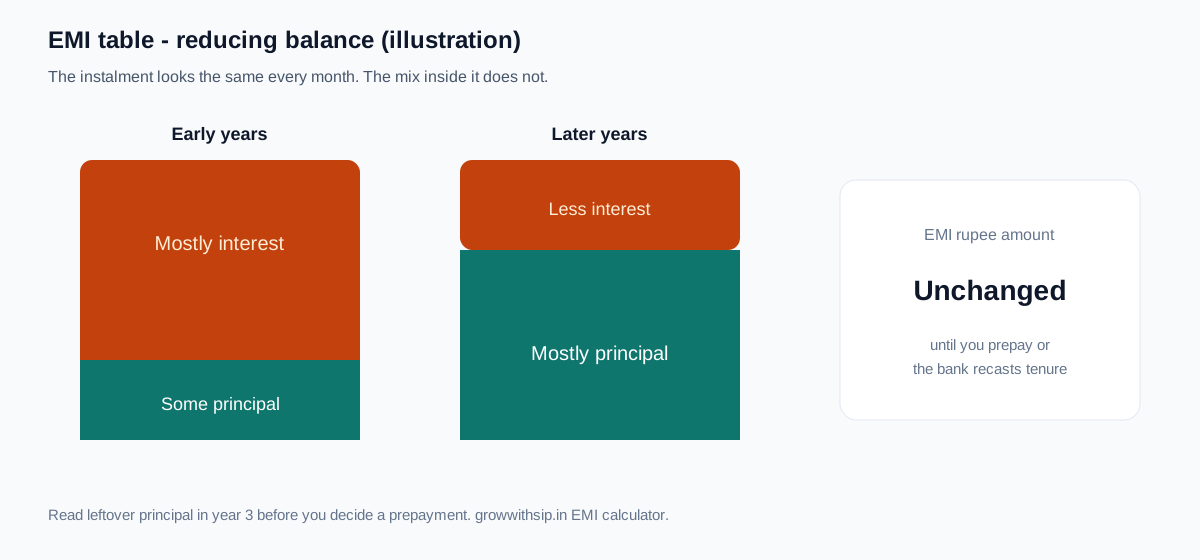
The EMI calculator amortisation is the opposite story. Early years are mostly interest. That is reducing balance, not a bug. The EMI rupee amount can stay flat while the mix inside it flips. If you are deciding a prepayment, look at how much principal is still left in year 3, not at the EMI. Prepay versus SIP uses that leftover principal as the thing you are actually buying down.

SWP: withdrawn versus remaining
SWP rows show how much you took that year and what is left. If remaining hits zero before the tenure ends, the illustration ran out of money at the constant return you typed. Real markets can run out earlier because returns are lumpy. Sequence risk explains why a healthy-looking average still fails. An inflation step-up on the withdrawal makes the remaining column fall faster. That is honest. A flat rupee SWP looks safer on the chart and silently cuts your lifestyle.
What a year-end row is not
- It is not NAV history or a CAMS / KFintech statement.
- It does not subtract expense ratio unless you lowered the return slider to approximate it.
- It does not skip SIPs you missed in March.
- It is not proof of funds for a visa, a bank, or a loan officer.
I would rather you treat a jump between year 7 and year 8 as “the formula at a flat 12%” than as a prediction that year 8 will be kind. Export to PDF or Excel when you want to sit with a spouse or a qualified professional without re-typing sliders. The file is a snapshot of the sliders at click time. If a row and a paragraph disagree, trust the sliders you set and the formula box on that calculator.