
What this SWP loop does each month
Grow the balance at r/12, then subtract the withdrawal if the balance can stand it. Inflation can step the debit once a year. The same rate every month is not sequence of returns. A bad first decade in markets can empty a corpus this smooth path still shows as healthy.
Defaults: ₹50 lakh, ₹25,000 a month, 20 years, 6% withdrawal inflation. At a constant 12% the loop still shows about ₹1.80 crore left. At a constant 5% it hits zero in year 17. Sequence risk note. SWP vs FD is the cash-sleeve mix.
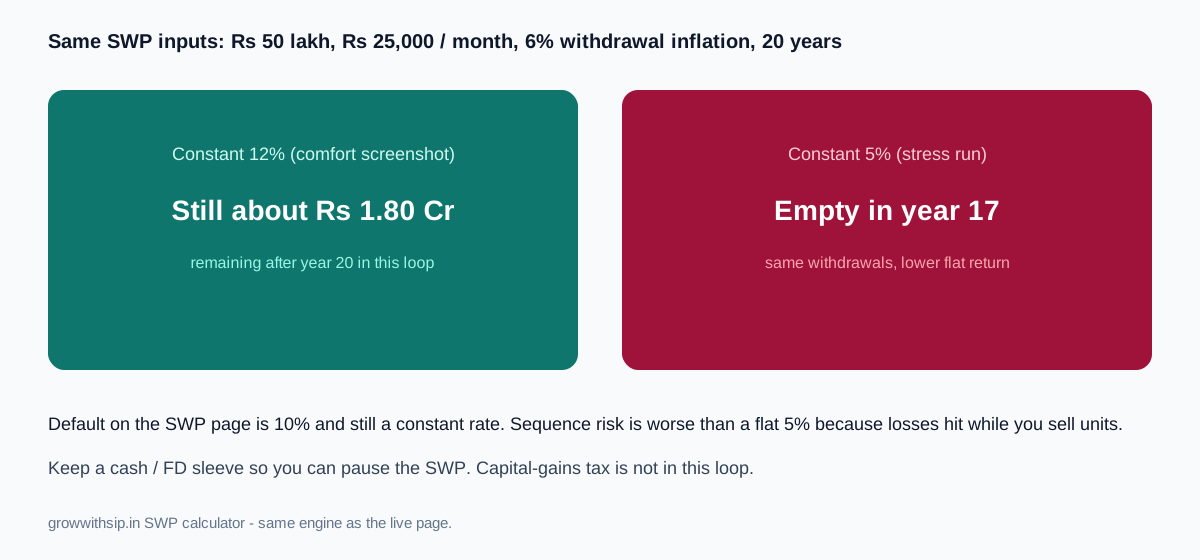

Smooth leftover vs empty
Motion is the same maths as the worksheet. Reduced-motion browsers skip the grow.
Calculator education
When to use this calculator
Use this page when you have (or are sizing) a corpus and want to see how long a monthly withdrawal could last under a constant return and an optional yearly hike in the debit.
How to read your result
Total withdrawn is the sum of monthly debits the loop could pay. Final value is what remains if the constant-rate path never runs dry. If the table hits zero early, the illustration depleted under those assumptions.
A smooth 12% path can still show a leftover pile while a bad first decade in real markets would not. Sequence of returns is not in this engine.
Key assumptions and limitations
- Each month: grow the balance at r/12, then subtract the withdrawal if the balance can stand it.
- Inflation, if set, steps the withdrawal once a year; the return stays a single constant.
- No cash sleeve, no sequence-of-returns simulation, no live NAV path.
Common mistakes
- Assuming average returns arrive smoothly every month.
- Starting withdrawals at a high percentage of corpus and then inflating the debit.
- Treating “corpus sustained” on a constant 12% run as a guarantee it lasts in markets.
Related guides
Related calculators
This SWP loop uses one constant monthly return. It cannot show sequence-of-returns risk or predict market paths. Full disclaimer.
Author / methodology
What I check before I live on an SWP
- Starting withdrawal as a percent of corpus. 6%+ with inflation step-up is aggressive.
- Eighteen to twenty-four months of the debit in cash or liquid that sleeve is not in the engine.
- The 0% empty-year line. Sequence risk is worse than a flat 0%.
The fund that pays the SWP is not a pension company
You redeem units. An insurer selling an annuity is a different counterparty with a different promise.
| Payer | What you actually receive | Failure mode this loop hides |
|---|---|---|
| Mutual fund (SWP) | Whatever NAV × units the mandate sells | A bad first decade; this page uses one constant rate |
| Life insurer (annuity) | A contractual rupee, subject to that company's solvency | You usually cannot inflate the cheque the way this slider does |
| Bank FD ladder | Interest or matured principal | Reinvestment rate, not sequence of equity returns |
Keep 18–24 months of the withdrawal in cash or a liquid fund. That sleeve is not in the SWP engine.
Constant 12% still shows leftover. Constant 5% empties in year 17. Sequence risk is worse than a flat 5%.