
The internet loves a false binary: “never prepay, SIP always wins at 12%.” Home loans in the early years are mostly interest. Look at the EMI calculator amortisation so extra rupees in year 3 buy more principal than extra rupees in year 18. Equity SIPs are not a guaranteed 12%. This page is how I compare the two without a motivational quote.

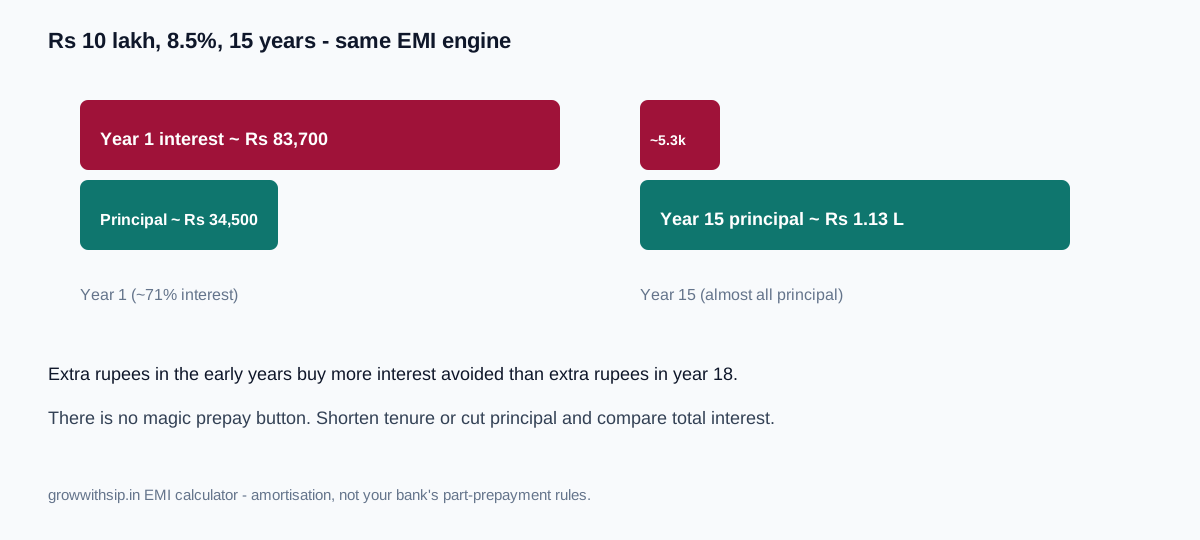
Read year 1 of the schedule first
Defaults on the EMI page: ₹10 lakh, 8.5%, 15 years. EMI is about ₹9,847. Total interest over the full tenure is about ₹7.73 lakh. Year 1 is about ₹83,700 interest and ₹34,500 principal roughly 71% interest. Year 15 is about ₹5,300 interest and ₹1.13 lakh principal. That is why “I will prepay later” is a different product from prepaying now.

Same extra rupees, two worksheets
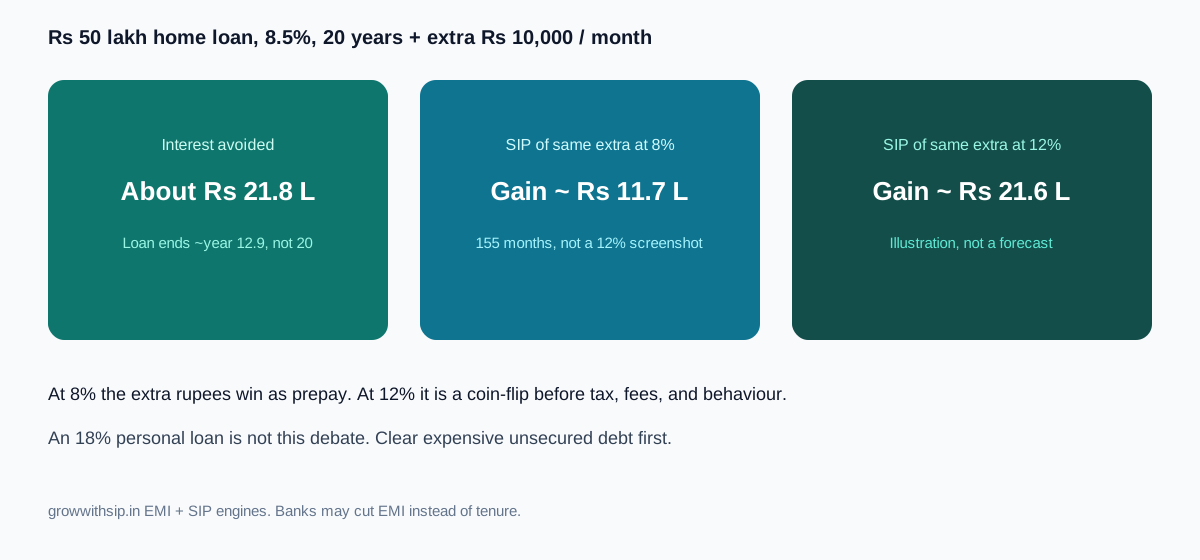
Take ₹10,000 a month you could add as a regular prepayment (or a higher EMI) or as a SIP. The EMI tool will not apply that extra for you. Shorten tenure, or use the extra-payment control on the personal loan calculator as a tenure-cut sketch, then compare total interest.
On a ₹50 lakh home loan at 8.5% for 20 years, scheduled interest is about ₹54.1 lakh. Adding ₹10,000 a month on top of the EMI, with tenure cut, finishes in about 12.9 years and avoids about ₹21.8 lakh of interest. An SIP of that same ₹10,000 for those 155 months gains about ₹11.7 lakh at 8% and about ₹21.6 lakh at 12% before tax, expense ratio, and the months you pause after a crash. The 12% slider is not a forecast.

On the smaller default loan (₹10 lakh, 15 years), an extra ₹10,000 is huge relative to the EMI. Tenure collapses to about 5.2 years and interest saved is about ₹5.31 lakh. A 63-month SIP of ₹10,000 only gains about ₹1.55 lakh at 8% or ₹2.50 lakh at 12%. That is why slogans copied from a ₹50 lakh loan do not apply to a small, interest-heavy schedule.
Tax and 80C muddy home loans
Interest on a home loan can have deduction limits; principal can sit in 80C. Prepaying principal may reduce a deduction you liked. Personal loans usually have no such romance. A ₹3 lakh personal loan at 18% for three years costs about ₹90,000 interest. Clear expensive unsecured debt before you debate Nifty.
Emergency cash is not extra EMI
Do not empty the FD emergency sleeve to prepay an 8% home loan. Sequence risk for a household is a job loss plus an EMI, not a chart. Keep the buffer, then split leftover between prepay and SIP if you must do both. A hybrid is allowed. A slogan is not.
Banks differ on part-prepayment charges and on whether they cut tenure or EMI. Use the calculators to size the interest, then ask the bank which lever they will actually move.